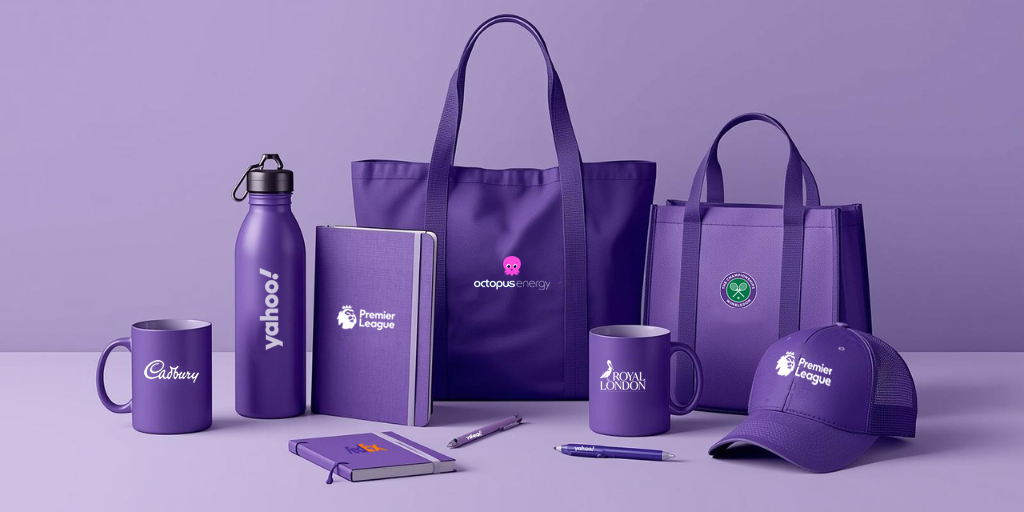
Promotional products remain one of the most effective marketing tools available today. This data-driven infographic highlights key statistics on brand recall, customer behaviour, and ROI — showing why branded merchandise continues to outperform traditional advertising.
Studies show promotional products generate long-term engagement, with many consumers keeping and using them for months or even years.
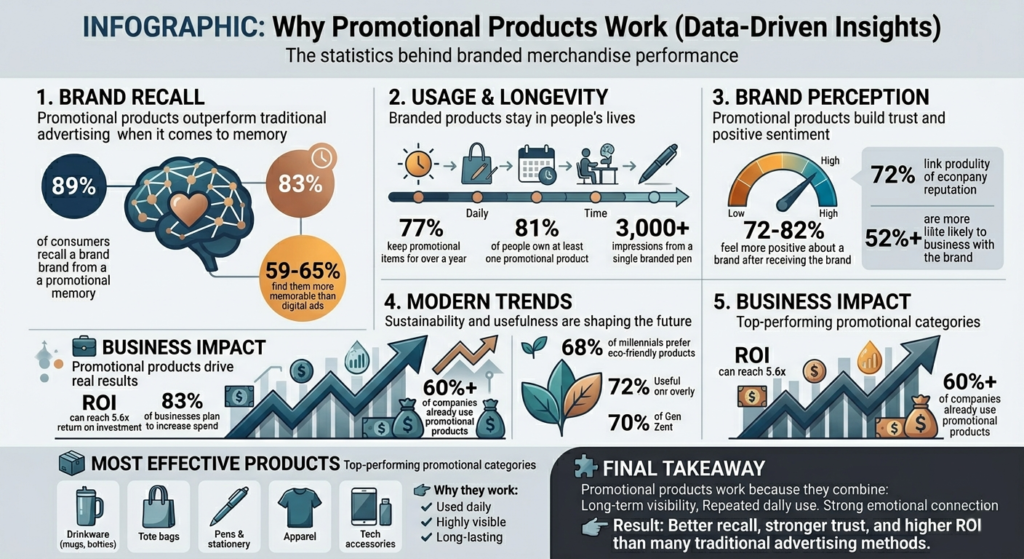
Promotional products statistics infographic showing brand recall, ROI, and consumer behaviour data.
Promotional products are highly memorable:
Branded products stay in people’s lives:
Promotional products improve how customers feel:
They influence real decisions:
Share this infographic on your site:
Source: Total Branded
The data highlights a clear shift in marketing:
Promotional merchandise works because it combines visibility with real-world use.
At Total Branded, we help businesses turn data into action with promotional products that deliver real results.
 Help & Contact